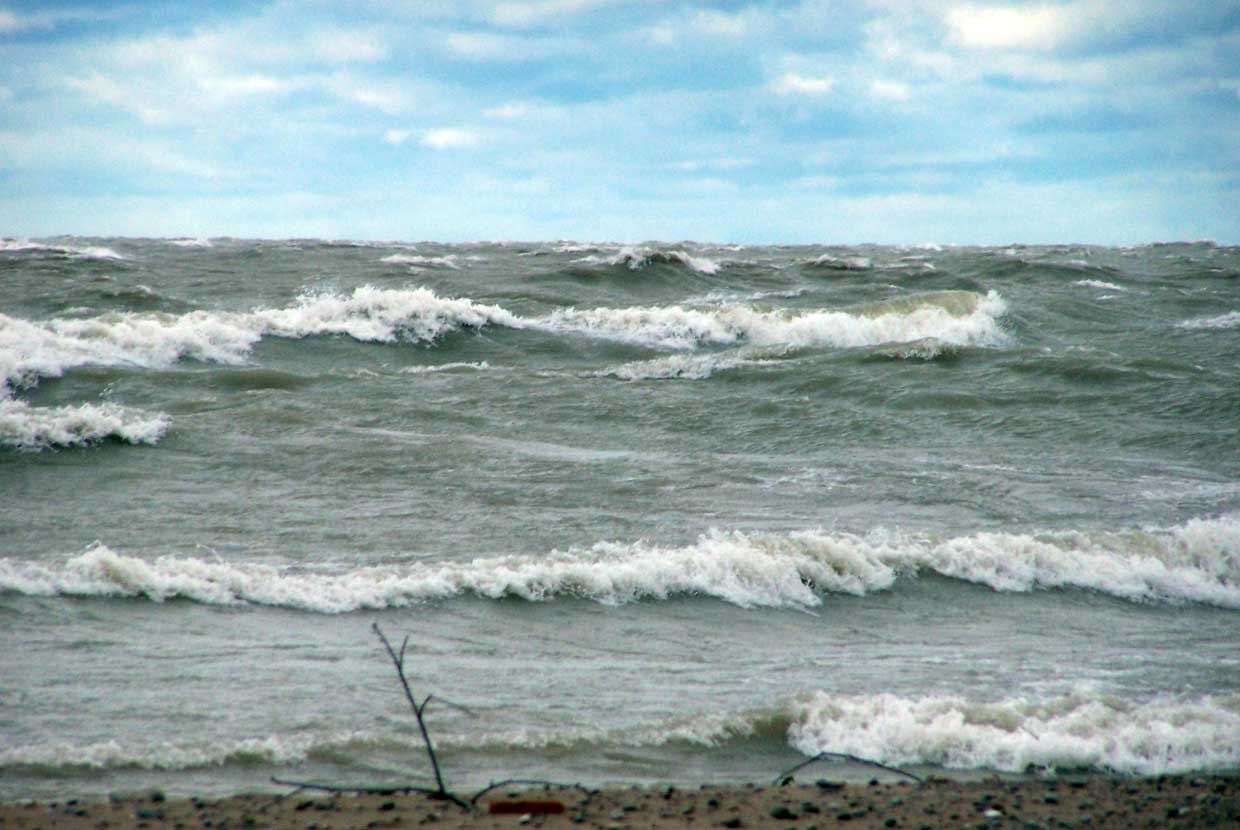
Lake Huron water levels above average

Increases in Lake Huron water levels can add to erosion
A March 2018 Monthly Water Level Bulletin, from Fisheries and Oceans Canada and Environment and Climate Change Canada, said water levels in the Great Lakes are above the long-term average for this time of year and above the level of Chart Datum. This is true for lakes Michigan and Huron; Lake Erie; Lake Ontario; Lake St. Clair; Lake Superior; and Montréal Harbour.
“Mariners should exercise extreme caution throughout the entire system, especially during periods of strong winds when water levels can rise or fall significantly in a short period of time,” the bulletin said.
A water level bulletin is prepared each month as a public service and is online at this link:
Lake Huron’s water level is higher than average but it is still about 0.4 metres below the recorded high for this period. Lake Huron has not experienced, in recent years, the record-setting water levels seen in other lakes of the Great Lakes-St. Lawrence Basin. Water levels are above average, however, even if they are not outside the standard range of variation in the Huron-Michigan system.
Chart Datum for Lake Huron in March is 176 metres. The all-time monthly mean for Lake Huron in March is 176.30 metres. The March 2018 monthly mean lake level for Lake Huron was 176.76 metres. This compares to 176.53 metres for the same month a year earlier. It is expected the Lake Huron water level will continue to rise in April.
“High (water) levels influence ... natural processes, like erosion and flooding,” according to the Lake Huron Centre for Coastal Conservation (https://www.lakehuron.ca/water-levels). To find out about best practices to limit shoreline erosion, and for warnings of potential bluff failure as a result of erosion and toe erosion, please visit the websites of conservation partners of the Healthy Lake Huron: Clean Water, Clean Beaches Partnership at healthylakehuron.ca. A Shoreline Slope Stability Risks and Hazards – Fact Sheet for Property Owners (Terraprobe Inc.) is online at abca.ca.
A number of natural and human factors influence water levels in the Great Lakes. Great Lake levels depend on their capacity to store water, how regulatory structures are operated, characteristics of outflow in outlet channels, and how much water each lake receives. A number of natural factors can affect lake levels. These factors include watershed runoff; evaporation from the surface of the lake; the patterns of rainfall, snow and other precipitation; inflow from lakes that are upstream; and outflow to lakes that are downstream. Human factors include water consumption, outlet channel dredging, outflow regulation, and water diversion.
The difference in high and low water levels of Lake Huron can be measured in metres. Changes in lake levels can happen quickly – such as following a major storm – or by season, depending on weather and evaporation. The ups and downs of Great Lakes water levels can take place over a short period (from less than an hour up to several days); to a seasonal period (one year); to long-term changes (over several years). When wind generates waves, this also affects fluctuations in water levels.
Long-term changes in lake water levels depend on the amount of water coming into the lake and the amount going out. This determines whether water levels rise, fall, or remain stable. When several months of above-average precipitation occur with cooler, cloudy conditions that cause less evaporation, levels gradually rise. Likewise, prolonged periods of lower-than average precipitation and warmer temperatures typically result in lowering of water levels. When less ice forms on the lake, as has happened in some recent winters, evaporation can be much greater.
There are gauging stations on the Canadian and United States sides of the border that help to determine an average water level each month. Gauging stations for Lakes Michigan and Huron are located at: Thessalon, Tobermory, Milwaukee, Ludington, Mackinaw City and Harbor Beach. To find out more visit this link:
Over recorded history, the Great Lakes have fluctuated between high and low levels. High levels were recorded in 1918, in the early 1930s, early 1950s, and sustained high levels from the 1970s to the record high levels of 1985-‘86, and in 1997. Low levels were experienced in the mid 1920s, early 1930s, late 1950s, record low levels in 1964, and in the late 1990s leading up to today.
Dr. Andrew D. Gronewold, Physical Scientist with the National Oceanic and Atmospheric Administration, is a keynote speaker at the Is the Coast Clear? conference hosted by the Lake Huron Centre for Coastal Conservation from May 10-11, 2018 in Grand Bend, Ontario. He is to present on Great Lakes Water Levels: Past, Present, and Future on Thursday, May 10, 2018 at 9:30 a.m. Dr. Gronewold is to provide an overview of historical water level data across the Great Lakes and an analysis of recent historic water level swings. His presentation will also include a discussion of Great Lakes water level forecasting across daily, seasonal, and multi-decade time scales.
